Table of Contents
India’s Carbon Credit Trading Scheme (CCTS) introduced by the BEE (Bureau of Energy Efficiency) marks a foundational step in India’s decarbonisation journey. Under this scheme, extensive energy sectors are notified to reduce their emission intensities through assigning them baseline targets along with the reduction targets monitored through reporting. These sectors form the bulk of all the industry emissions of India making the scheme critical to meet the national climate goals and to ensure global competitiveness.
This blog explored The Carbon Credit Trading Scheme and its evolving landscape, offering sector specific insights and targets. It explores how different sectors are generating millions of tons of CO2 and what kind of technologies they are planning to adopt or are already in place in those companies to build towards a greener future.
Introduction to Carbon Credit Trading Scheme (CCTS)
CCTS was implemented in India with keeping in mind the India’s commitment to reduce greenhouse gas emissions (GHG’s) by complying and to meet the target set under the Paris Agreement. This mechanism was introduced to push India’s industrial decarbonisation to a low, and this scheme gives a base with a legal, market-based mechanism under Energy Conservation (Amendment) Act, 2022.
The goal behind implementing Carbon Credit Trading Scheme is to provide incentives to the companies who met their targets to reduce carbon emissions. Before implementing the Carbon trading scheme, India already had in place schemes like PAT (Perform, Achieve, Trade) and REC’s (Renewable Energy Certificates) etc. and these schemes use energy savings to drive their reductions in carbon emissions, while CCTS unifies these efforts and scales them through measuring the reductions in emissions by emission intensity.
So, CCTS was implemented to help India transition towards a sustainable future and to meet the climate goals – 45% by 2030 and to have net zero emissions by 2070.
To know more in detail about the Carbon Credit Trading Scheme and how it works, and the regulatory bodies involved – read the blog here.
Advantages of CCTS for the Indian Industries
CCTS has several other benefits pertaining to the economic and sustainable areas, some of which are:
- Encouraging more investments in cleaner and greener technologies which will help reduce their emissions
- Help in providing new revenue streams to the industries that exceeds their targets in terms of carbon credits and penalize the entities that do not meet their targets
- Green projects with lower emissions attract better financing in terms of capital rates and foreign investment.
Though other countries or regions like EU , China, South Korea already have this in place, this is India’s 1st effort towards a greener future where they are penalizing the organisations who exceed their carbon emissions targets.
How the CCTS scheme works and the sectors that were notified
Now that we understand what CCTS is, why it was implemented, and its benefits, let’s talk about how the introductory phase works and which were the sectors that were notified under this scheme. The Bureau of Energy Efficiency (BEE) has sent out 2 notifications – one went out on 16th April 2025 and other came out on 23rd June 2025 – notifying the sectors that fall under CCTS and the companies that need to adhere to the scheme. Before we dive into specific sector wise breakdown of key figures, let’s understand the mechanisms which were introduced for Carbon Credits Trading Scheme (CCTS).
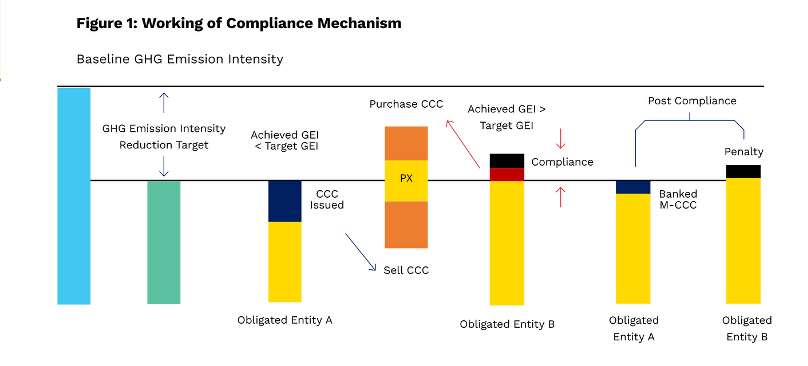
- Compliance Mechanism
- Voluntary Mechanism
The first one is compliance mechanism in which industries under several energy extensive industries are given targets to reduce their emission intensities. Once they reduce their intensities below their targets, they earn Carbon Credit Certificates (CCC’s) and if the companies don’t meet their targets and cross their thresholds, they have an option to purchase the credits or pay a penalty. Another important thing to keep in mind while complying to CCTS is that it operates gate-to-gate i.e. records procedures under Scope 1 and Scope 2 reporting along with the emissions from combustion processes that happen inside the manufacturing units.
Also, to provide uniformity amongst the nine sectors adhering to CCTS, all emissions are verified under Global Warming Potential (GWP) components.
The other mechanism that is classified under CCTS is voluntary mechanism that caters to Voluntary Carbon Market within Indian Carbon Market (ICM). In this voluntary framework, even the industries not mandated under CCTS, can voluntarily reduce emissions and can trade credits with the complied industries if needed. This framework was designed to encourage MSMEs, corporates and service sector industries to adopt sustainability by providing them an additional revenue stream.
The CCTS tends to an Indian carbon market (ICM) to build mechanisms to drive companies to invest in low-carbon technologies, and to incentivize to cope with the global competition.
CCTS Implementation Timeline and Targets
Now as we know the basics of this scheme and mechanisms involved in the process, let’s have a look at the timeline for the implementation and what you must keep in mind to fulfill the targets including documentation and submissions involved along the process.
The baseline period will be considered as FY 2023-24, which means companies will use their emission intensity from that year as a benchmark for the coming years. Below mentioned is the tie line starting from April 2025, when the companies must ideally start the process and the submission of the reports to the ACVA’s will be happening next year i.e. 2026.
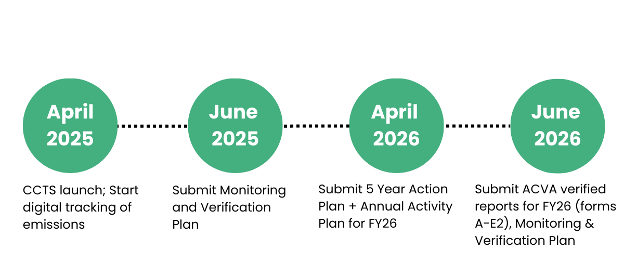
- April 2025: BEE formally launched their first notification with entities under specific sectors starting to digitally track their emissions.
- June 2025: The companies complied must submit their Monitoring and Verification (MRV) plans for the CCTS program.
- April 2026: The entities after that will have to submit a 5-year action plan along with an annual activity plan for FY26.
- June 2026: FY26 ACVA-verified reports (Forms A, B, C, D and E2) need to be submitted by the companies and include their Monitoring and Verification Plan.
The Target structure for the entities involved in this scheme are divided into 2 phases: Phase 1 (FY 2025-26) aims a reduction of around 1-3% across all sectors and then in the phase 2 i.e. FY 2026-27 where the reductions are aimed at 2-8%, keeping baseline as a benchmark for the involved sectors.
Approximate 738 companies are supposed to be adhered to this scheme and will be involved in trading carbon credits for extra income or loss of income if they fail to meet them depending on their carbon emissions at the end of each cycle/phase.
Now as we know the timeline and before diving deep into the 9 sectors under CCTS, to have an insight on the CCTS calculation methodology – read all about it in our blog.
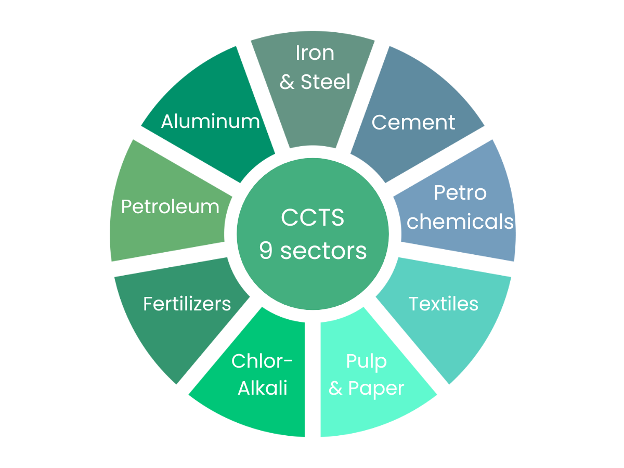
What are the 9 sectors under CCTS?
CCTS currently covers 9 energy intensive sectors and 730 companies spanning across only these 9 sectors. The sectors included under this scheme are- iron and steel, aluminum, cement, fertilizers, paper and pulp, chlor-alkali, petroleum refineries, petroleum units, and textile.
The number of companies included under this each sector are as below:
- Aluminium – 13 companies
- Cement – 186 companies
- Chlor-Alkali – 30 companies
- Pulp & Paper – 114 companies
- Petrochemicals – 11 companies
- Refineries – 23 companies
- Textiles – 165 companies
- Iron & Steel – 253 companies
- Fertilizers – 21 companies
Now let’s dive deep into the details of each of these sectors and the key highlights to know about the sectors that come under the CCTS scheme.
The 9 Sectors Under CCTS Compliance
1. Iron & Steel: Emission Intensity & Targets under CCTS
The iron and steel sector is one of the largest polluters among the nine sectors, with approximately 300 million tons of CO2 equivalent emitted each year by this industry. These emissions constitute 12% of the total industrial emissions in India- which is really a huge number as there are many energy intensive industries.
Key Highlights about the iron and steel industry:
- A total of 253 companies is covered under CCTS
- Major players involved in iron and steel sector are Tata Steel, JSW Steel, SAIL, Jindal Steel
- Emission intensity: 2.2-3.6 tons CO2 per ton of steel
- Reduction Targets: Iron & steel companies face 2- 3% emission intensity reduction in 2025-26, tightening to 4 -6% by 2026-27, depending on the companies, keeping baseline as a benchmark.
This chart illustrates the baseline GHG emission intensity (2023-24) across the iron and steel sector and shows that Ferro Alloys have the highest emission intensity among the sub sectors of around 5.36 tCO₂e per tonne , and then is followed by blast furnace (2.90) and sponge iron (2.58), followed by emission intensity targets for the compliance year 2025-26 and 2026-27.

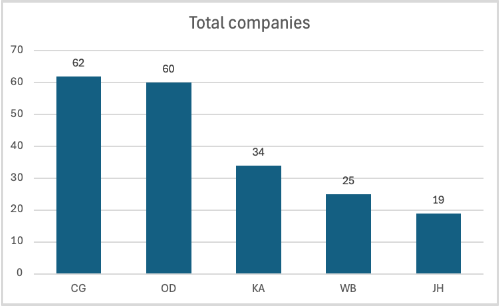
This bar graph depicts how many companies fall under CCTS in each state with the total number of 253 companies notified, which depicts that Chhattisgarh has the highest number of companies (62) falling under CCTS and closely followed by Odisha (60).
To know more about your emission intensity baseline and reduction targets, refer to the official notification by BEE- here.
This bar graph depicts 6 companies across 3 sectors (steel, ferro alloys and sponge iron) in Iron and Steel industries and shows the highest emitters in each of these sectors.
The steel industry is particularly challenging since they are more coal dependent. However, companies are starting to look for other alternatives such as electric arc furnaces, increasing steel recycling, and green hydrogen technology to minimize their carbon footprint and to meet their targets.
How does sentra.world help with CCTS?
sentra.world empowers businesses to comply with Carbon Credit Trading Scheme (CCTS) by providing an integrated digital platform for calculating, verifying and submitting carbon emissions along with simplifying carbon emissions.
sentra.world supports you in fulfilling your CCTS compliance as per BEE, Ministry of Power, through a comprehensive end-to-end solution, which includes:
- CO₂ emissions calculation as per CCTS methodology
- Digital platform to track emissions monthly
- Action plan to meet CCTS reduction targets
- Documentation for submission
- 3rd party verification
Need help with tracking and calculating emissions and the entire process involved in CCTS?
2. Cement: Process Emissions, Clinker & Targets
India’s cement industry produces approximately 177 million tons of Co2 equivalent emissions each year, which is about 6% of all industrial emissions in the country. The cement sector has a total of around 186 companies such as UltraTech, ACC, Ambuja and Shree Cement among the prominent names.
Key Characteristics:
- Approximate emission intensity of 0.44–0.85 tons CO2 per ton of cement across the sector
- 56% of major emissions come from limestone processing
- Reduction Targets for the cement companies are ~2% reduction in 2025-26, increasing to 2.5–3% by 2026-27, keeping baseline as a benchmark.
This bar graph depicts the average of Baseline GHG emission intensities across the 6 sub sectors under cement sector for the year 2023-24.
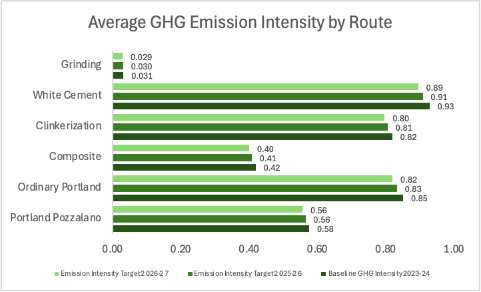
This chart illustrates the baseline GHG emission intensity (2023-24) across the cement sector and shows that White cement has the highest emission intensity among the sub sectors of around 0.93 tCO₂e per tonne , and then is followed by Ordinary Portland (2.90) and Clinkerization (0.82), followed by emission intensity targets for the compliance year 2025-26 and 2026-27.
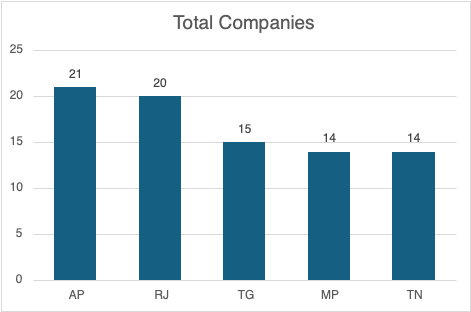
This bar graph depicts how many companies fall under CCTS in each state with the total number of 187 companies notified, which depicts that Andhra Pradesh has the highest number of companies (21) falling under CCTS and closely followed by Rajasthan (20).
To know more about your emission intensity baseline and reduction targets, refer to the official notification by BEE- here.
Cement companies in India are already starting to target alternative fuels, reducing the amount of clinker, and investigating carbon capture technologies to achieve their emission reduction goals.
3. Aluminum: Smelters and FRP – GEI Benchmarks
The aluminum sector produces 65 million tons of CO2 equivalent emissions annually, which is about 2% of total industrial emissions in India. The aluminum sector has 13 primary aluminum producers such as Vedanta, Hindalco, NALCO, and BALCO included in the notification shared by BEE.
Industry Profile:
- Extremely energy-intensive, highest emitter of carbon: Primary Smelter has the baseline emission of 15–20 tCO₂/t aluminum (e.g., Hindalco Renukoot ~20.6, NALCO Angul ~17.3, Vedanta Jharsuguda ~17.1), Downstream (FRP/Rolling) have a baseline ~1.1 – 1.4 tCO₂/t (Hindalco Mouda/Taloja/Hirakud FRP)
- India’s carbon intensity in this sector 18 tCO2/t exceeds global average of 15.1 tCO2/t
- Reduction Targets for aluminum producers is ~2% reduction in 2025-26 which tightening to 2.4–2.6% by 2026-27.
This bar graph depicts the average of Baseline GHG emission intensities across the 3 sub sectors under aluminum sector for the year 2023-24.
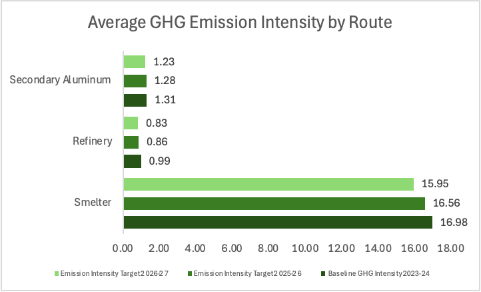
This chart illustrates the baseline GHG emission intensity (2023-24) across the aluminum sector and shows that smelter has the highest emission intensity among the sub sectors of around 16.98 tCO₂e per tonne , and then there is a large difference between the other two sub sectors with way lower emission intensity i.e. Refinery (0.99) and Secondary Aluminum(1.31), followed by emission intensity targets for the compliance year 2025-26 and 2026-27.
To know more about your emission intensity baseline and reduction targets, refer to the official notification by BEE- here.
Nowadays, organizations are using greener technologies, scaling secondary aluminum output through recycling, and entering into renewable energy purchase agreements to lower their carbon emissions.
4. Petrochemical Units: Naphtha/Gas Cracking GEI
The petrochemical sector accounts for 2.5% of India’s industrial emissions and produces 70 million tons of CO2e emissions annually. Twenty significant petrochemical hubs, including Reliance Industries, IOCL, ONGC OPAL, and Haldia Petrochemicals, are part of this sector and come under the CCTS compliance mechanism.
Sector Specifics data for petrochemical units:
High reliance on naphtha cracking which gives out emission intensity of around 0.83 to 1.41 tons CO2 per ton of product. The reduction targets for petrochemical plants are also approximately 2–3% in 2025–2026 and will be an approximate value of 4-5 % by 2026–2027.
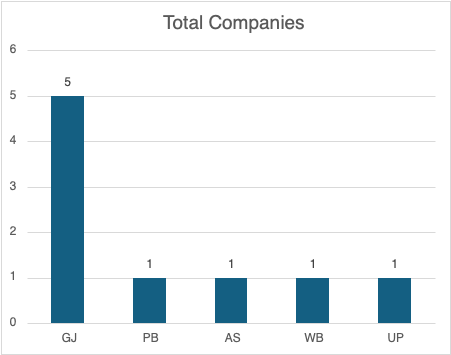
This bar graph depicts how many companies fall under CCTS in each state with the total number of 11 companies notified, which depicts that Gujarat has the highest number of companies (5) falling under CCTS.
To know more about your emission intensity baseline and reduction targets, refer to the official notification by BEE- here.
To cut emissions, these industries are already investigating bio-based feedstocks, integrating green hydrogen, and assessing alternative feedstocks like ethane as well.
5. Focus on Efficiency and GEI in Petroleum Refining
The refining of petroleum generates an estimated 85 million tons of CO2 emissions per year and which accounts for 3% of India’s total industrial emissions.
Key Metrics:
- Emission intensity: 5-8.5 tons CO2 per ton of refined product
- Reduction Targets for Refineries range from~ 4.2-5.5 % reduction in 2025-26, then to ~ 5% by 2026-27.

This bar graph depicts how many companies fall under CCTS in each state with the total number of 21 companies notified, which depicts that Assam and Gujarat have the highest number of companies (4) falling under CCTS and closely followed by Maharashtra (2).
To know more about your emission intensity baseline and reduction targets, refer to the official notification by BEE- here.
Businesses in the refinery industry are investing in infrastructure of their facilities to improve energy performance, integrating renewable energy into their daily industrial operations, and processing green hydrogen.
6. Fertilizers: Green Hydrogen, Ammonia, and Targets
The fertilizer sector in India produces 75 million tons of CO2 emissions/year which roughly accounts for 2.7% of total industry emissions. This industry consists of 20 major chemicals, or you can say fertilizer facilities, such as RCF, IFFCO, NFL, GSFC, and Chambal Fertilizers.
Industry Characteristics:
- Emission intensity for this sector is of around 1.4-2.6 tons CO2 per ton of fertilizer – and the majority comes from the production of ammonia as that process is highly carbon extensive.
Within the fertilizer industry, companies are now more focused on green hydrogen to produce ammonia as that process as discussed is highly carbon extensive, investing more in energy performance improvements, and in renewable energy sources.
7. Textiles: Goals, Energy Use, and Electrification
The textile industry in India emits 50 million tons of CO2 emissions yearly, or 1.8% of total industrial emissions. The textile sector consists of 150 facilities, including fully integrated companies like Trident, Welspun, and Arvind Mills.
Sector Details:
- Each ton of textile product has an emission intensity of 2-4 tons of CO2,
contributes 2% of greenhouse gas emissions worldwide. - Reduction Targets: Textile facilities will have to cut about 2% in 2025–2026 and then by about 2.5% in 2026–2027.
To know more about your emission intensity baseline and reduction targets, refer to the official notification by This bar graph depicts the average of Baseline GHG emission intensities across the 4 sub sectors under textile sector for the year 2023-24.
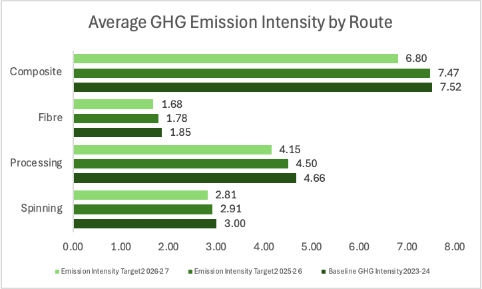
This chart illustrates the baseline GHG emission intensity (2023-24) across the textile sector and shows that Composite has the highest emission intensity among the sub sectors of around 7.24 tCO₂e per tonne , and the two sub sectors with emission intensity of Processing (4.66) and Spinning (3.00), followed by emission intensity targets for the compliance year 2025-26 and 2026-27.
To know more about your emission intensity baseline and reduction targets, refer to the official notification by BEE- here.
More textile businesses are making investments in energy-efficient production methods like electric heating systems, and renewable energy-related industries which are said to be profitable in the coming future and given i.e. sustainability.
8. Pulp & Paper: Biomass, WHR, and Targets
Pulp and Paper sector produces an estimate of ~10.93 MtCO₂e of CO2 every year which also accounts for 0.4% of total industry emissions. There are around 53 production facilities in this sector, which includes well-known companies like JK Paper, ITC, and West Coast Paper among other prevalent names from Pulp & Paper industry.
Key numbers and targets for this industry:
- CO2 emissions for this industry are 0.8–1.2 tons per ton of paper
- The reduction targets for pulp and paper producers are set at around 3% in 2025–2026 and will increase to 3.5–4% by 2026–2027.
To know more about your emission intensity baseline and reduction targets, refer to the official notification by This bar graph depicts the average of Baseline GHG emission intensities across the 4 sub sectors under pulp and paper sector for the year 2023-24.
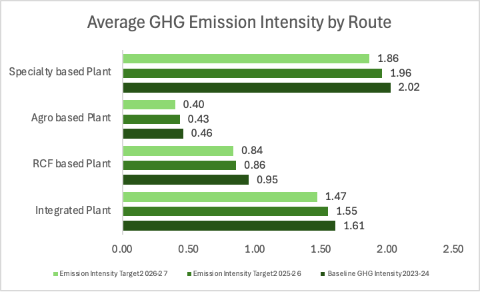
This chart illustrates the baseline GHG emission intensity (2023-24) across the pulp & paper sector and shows that Specialty based plant has the highest emission intensity among the sub sectors of around 2.02 tCO₂e per tonne , and the followed by other two sub sectors with emission intensity of Integrated plant (1.61) and RCF based plant(0.95), followed by emission intensity targets for the compliance year 2025-26 and 2026-27.
To know more about your emission intensity baseline and reduction targets, refer to the official notification by BEE- here.
Businesses are embracing biomass fuels, putting waste heat recovery systems in place, and streamlining their operations to increase productivity with greener technology-lower emissions in mind.
9. Chlor-alkali: Membrane Cell Tech & Targets
The emissions of the chlor-alkali sector account for 8 million tons of CO2 equivalent emissions each year and 0.3% of India’s industrial emissions. This industry covers 30 production units, and the major companies are DCW, GHCL, and Grasim.
Technical Specifications:
- Emission intensity for this industry is 1.5-2.0 tons CO2 per ton of caustic soda
- Reduction Target for Chlor-alkali facilities face ~4–5% reduction in 2025-26 and then tightening to 7–8% by 2026-27.
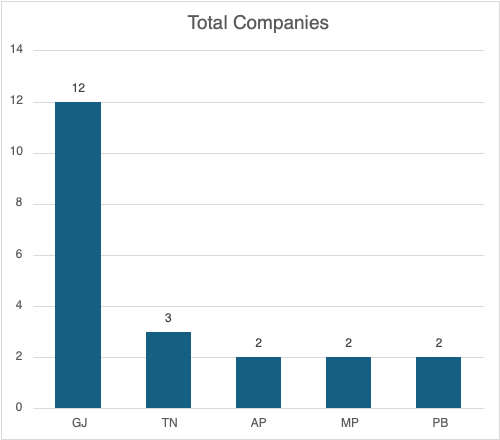
This bar graph depicts how many companies fall under CCTS in each state with the total number of 21 companies notified, which depicts that Gujarat has the highest number of companies (12) falling under CCTS.
To know more about your emission intensity baseline and reduction targets, refer to the official notification by BEE- here.
The industry aims to adopt membrane cell technology and increase energy efficiency in electrolysis processes to reduce emissions and to meet targets.
Conclusion
India’s new Carbon Credit Trading Scheme, introduced in these 9 sectors, is a concrete step the country is taking towards achieving net-zero outcomes. 738 industrial establishments will have a carbon trading mandate by 2026, and this will be done through the Indian Carbon Market or the ICM and understand to reduce their emissions and will develop new business opportunities.
CCTS and its operational practices will have better success depending on how well each of these sectors adjusts to them, and through how well they measure, report, and verify mechanisms. The mechanisms of CCC will be used for emissions reduction from here on, and how these lead businesses to sustain more interventions.
The Energy Conservation Act 2001 has a comprehensive compliance mechanism under it, which is being developed to make sure that carbon emissions measurement forms the bedrock of industrial operations in India.